
# Data Democratization
# Data Labs
# Superset - SQL Lab
SQL Lab is a modern, feature.rich SQL IDE written in React. (React is a JavaScript library for building user interfaces).
# Feature Overview
- Connects to just about any database backend
- A multi-tab environment to work on miltiple queries at a time
- A smooth flow to visualize your query results using Superset's rich visualization capabilities
- Browse database metadata: tables, columns, indexes, partitions
- Support for long-running queries
- Uses the celery distributed queue to dispatch query handling to workers
- Supports defining a "results backend" to persist query results
- A search engine to find queries executed in the past
- Supports templating using the Jinga templating languaje which allows for using macros in your SQL code
# Extra features
Hit alt+enter as a keyboard shortcut to run your query.
# Jupyter Notebook
Jupyter is an interactive working environment that allows you to dynamically develop Python code, while integrate both code blocks as text, graphs or images in the same document. It is widely used in numerical analysis, statistics and machine learning, among other fields of computer science and mathematics. CPH has Jupyter Hub integration so you can explore your Data. Upon access you will find the file Welcome-Example.ipynb that will show you how you can explore your data on the platform. If you want to persist your files, place them in the folder save_data. Inside it, enco You will find the folders python and data. The first is intended to store notebooks and code scripts, and the second is data files (such as a CSV). Files not under save_data are ephemeral.
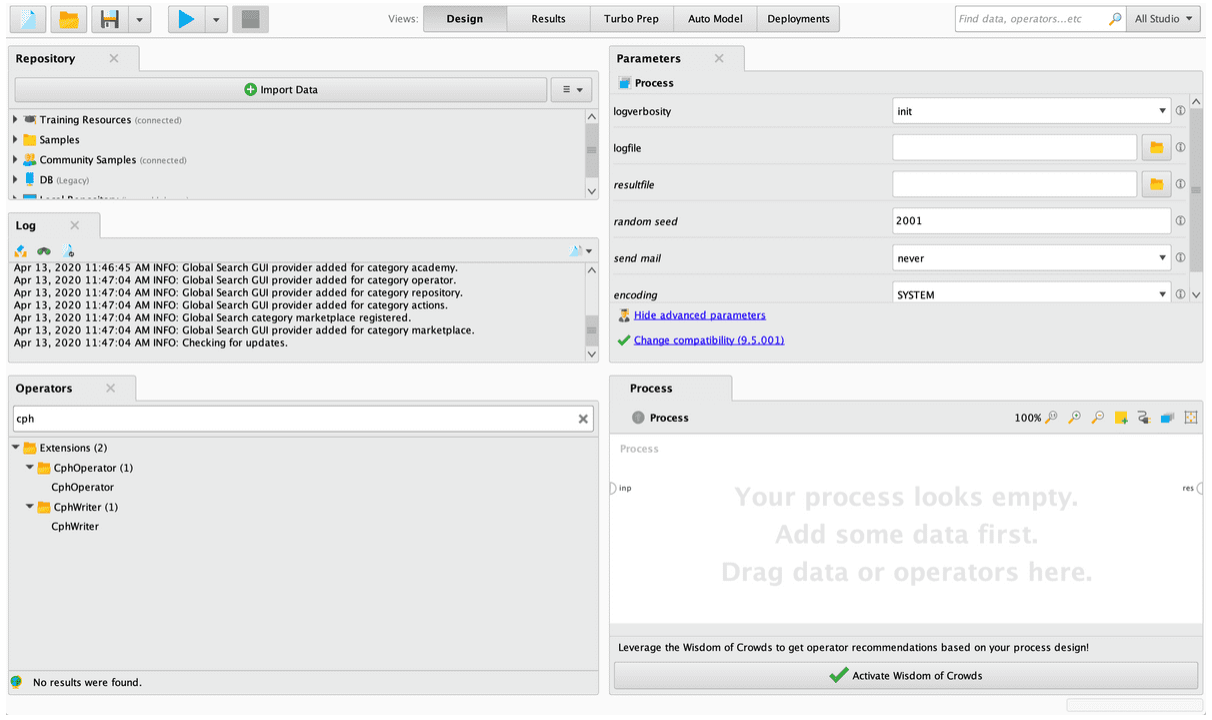
# Knolar Extension for RapidMiner
RapidMiner es un programa informático para el análisis y minería de datos. Permite el desarrollo de procesos de análisis de datos mediante el encadenamiento de operadores a través de un entorno gráfico.
# Instructions Rapidminer Add-on
As a first step it is necessary to download the Rapidminer extension at the following link:
Then copy the file to the Rapidminer extensions folder, which will depend on the OS you have:
// Windows
C:\Users\<username>\.RapidMiner\extensions\

// Linux or Mac OSX
~/.Rapiminer/extensions/
- It is necessary to restart Rapidminer in case you have had it open during this process.
- When you start it again, you can see the extension icon as part of the installed extensions.
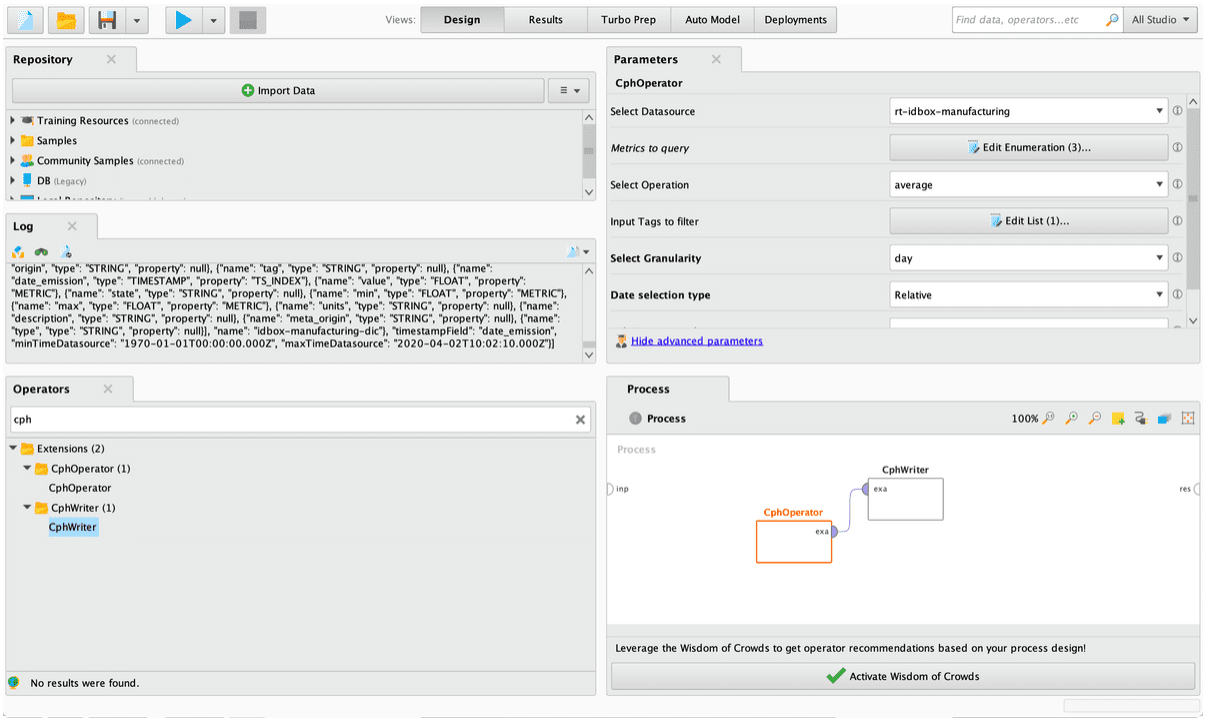
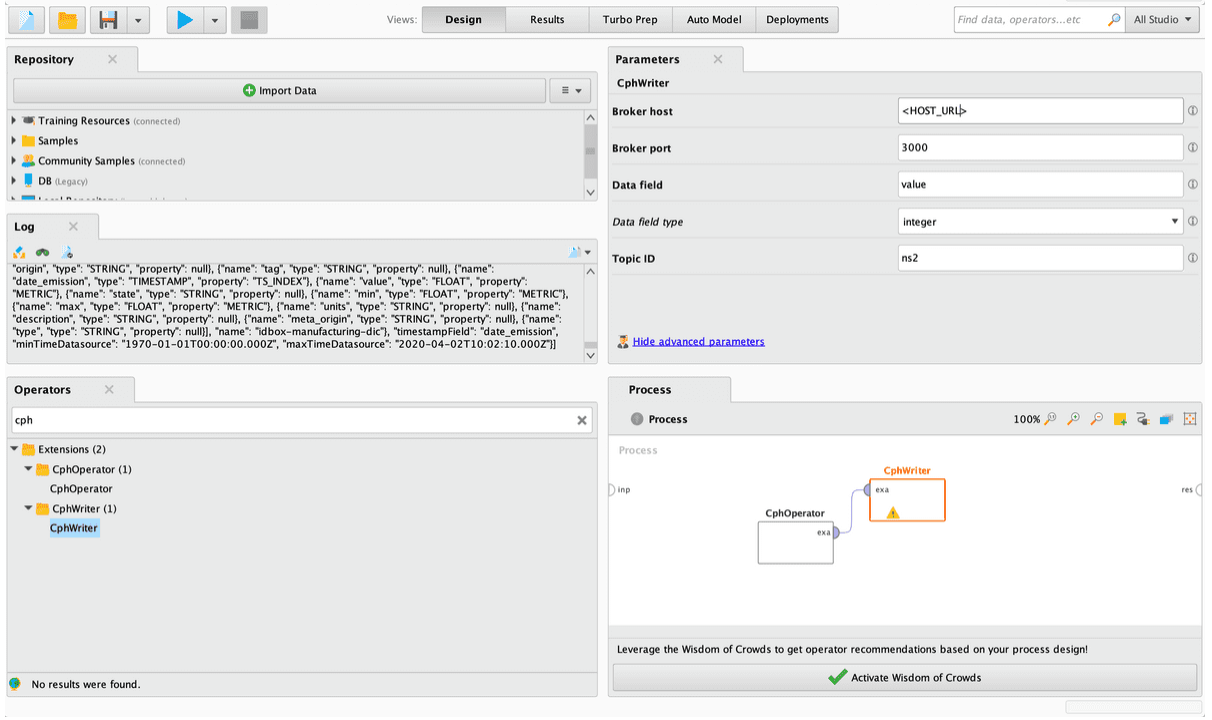
- Once the application is opened it will be available in the operator panel: CPHOperator or CPHWriter
- Finally, complete the form as required and run the Rapidminer process, making sure you have connected the operator output to results or the operator you require.
# Data visualization
# Custom Time Series
Time series is a tool characterized mainly by representing data as a function of time. From the different fields to fill in (Enity, Prefixes, Filter Field, Filter Values, Metrics, Operation, Time and Granularity), we should know that:
- Enity: It refers to the name of the ingestion you want to visualize.
- Prefixes: select the prefix on which the visualization is to be based.
- Filter Field: You must select the field by which you want to fliter in the chart.
- Filter values: You must select the value by which you want to fliter in the chart.
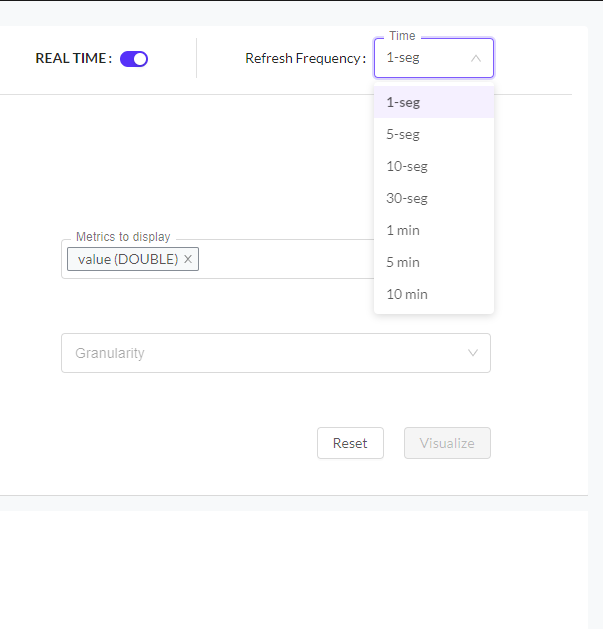
- Metrics: The value of the data to be displayed in the chart.
- Operation: It consists of indicating the operation that you want to represent in the graph. The different options are:
- RAW: The value without any calculation modification.
- AVG: The average of the values.
- LAST: The last value you want to display.
- NEXT: The next value you want to display.
- SNAP: A image you take of a sample of data, taking only part of the sample.
- Time: It is the period in which you want to represent the data in the graph.
- Granularity: It is the period of time for which the data are to be displayed.
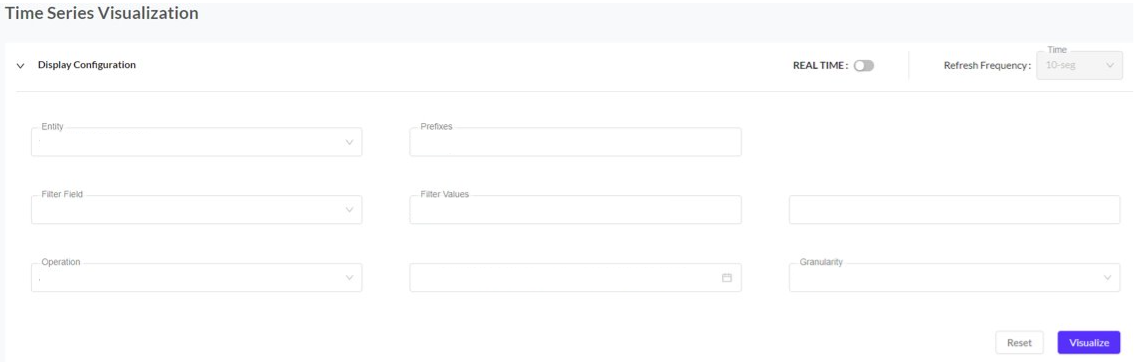
If you want the display to be in real time, you must activate the 'REAL TIME' option at the top right and, once activated, you can choose the time frequency fot the display.
# Grafana
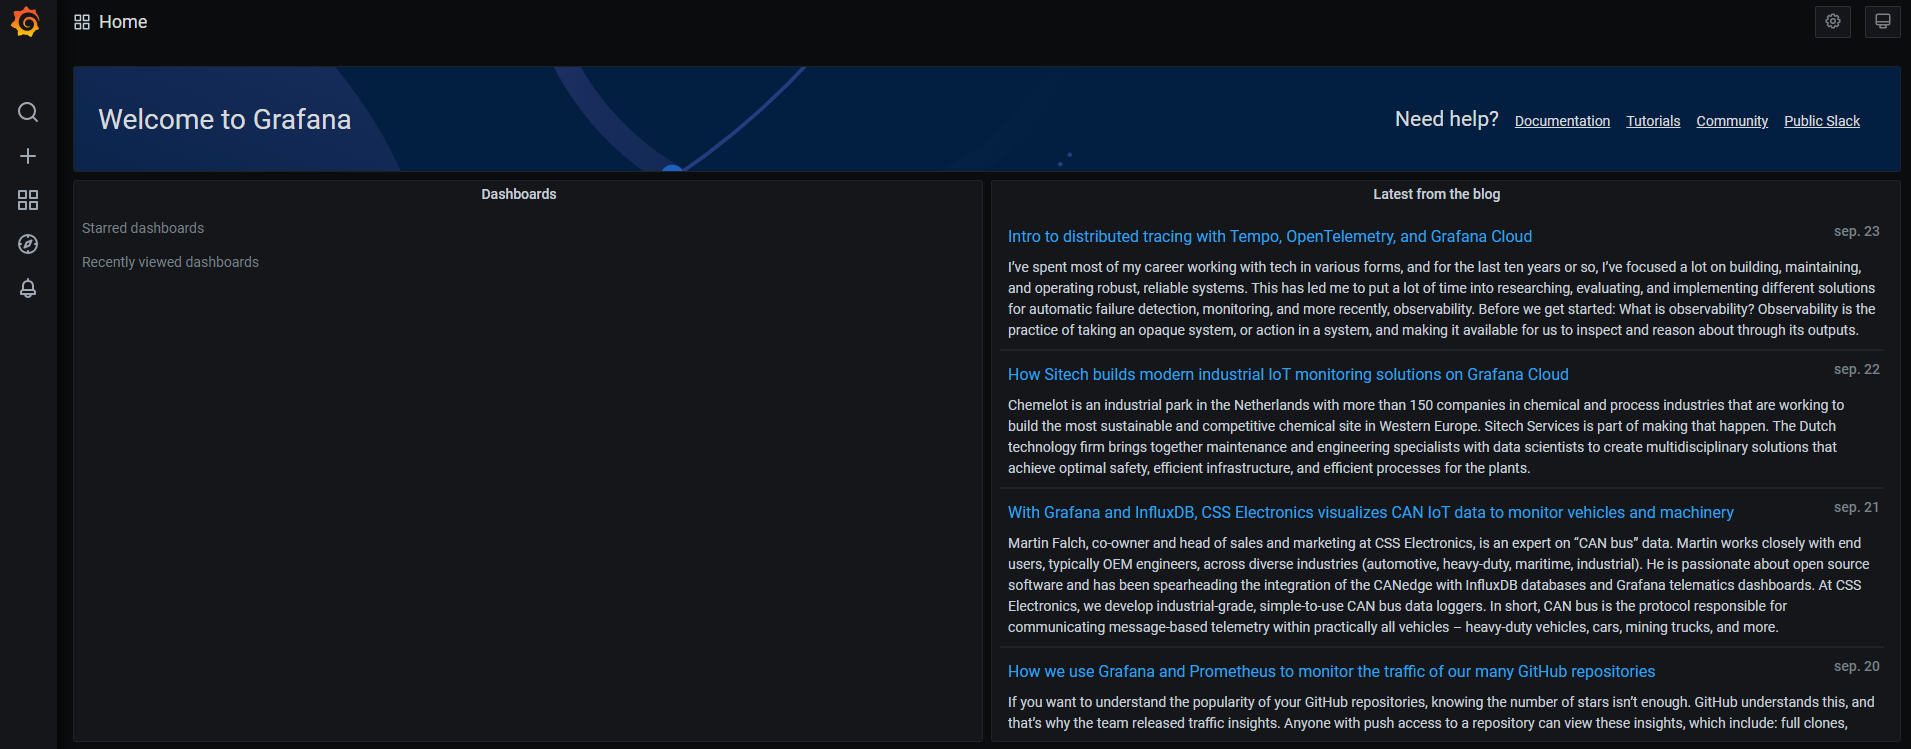
Knolar provides direct access to Grafana, a very powerful tool for data visualization. In it we can create a multitude of graphs and dashboards with the data provided by the ingestion.

The main page when accessing Grafana will be:
The different applications that Grafana has are:
Search: Here you can search fot the different dashboard that have been previously created
Create: This is the most important section. Inside it, you can access to three different sections:
- Dashboard: You can create a new dashboard
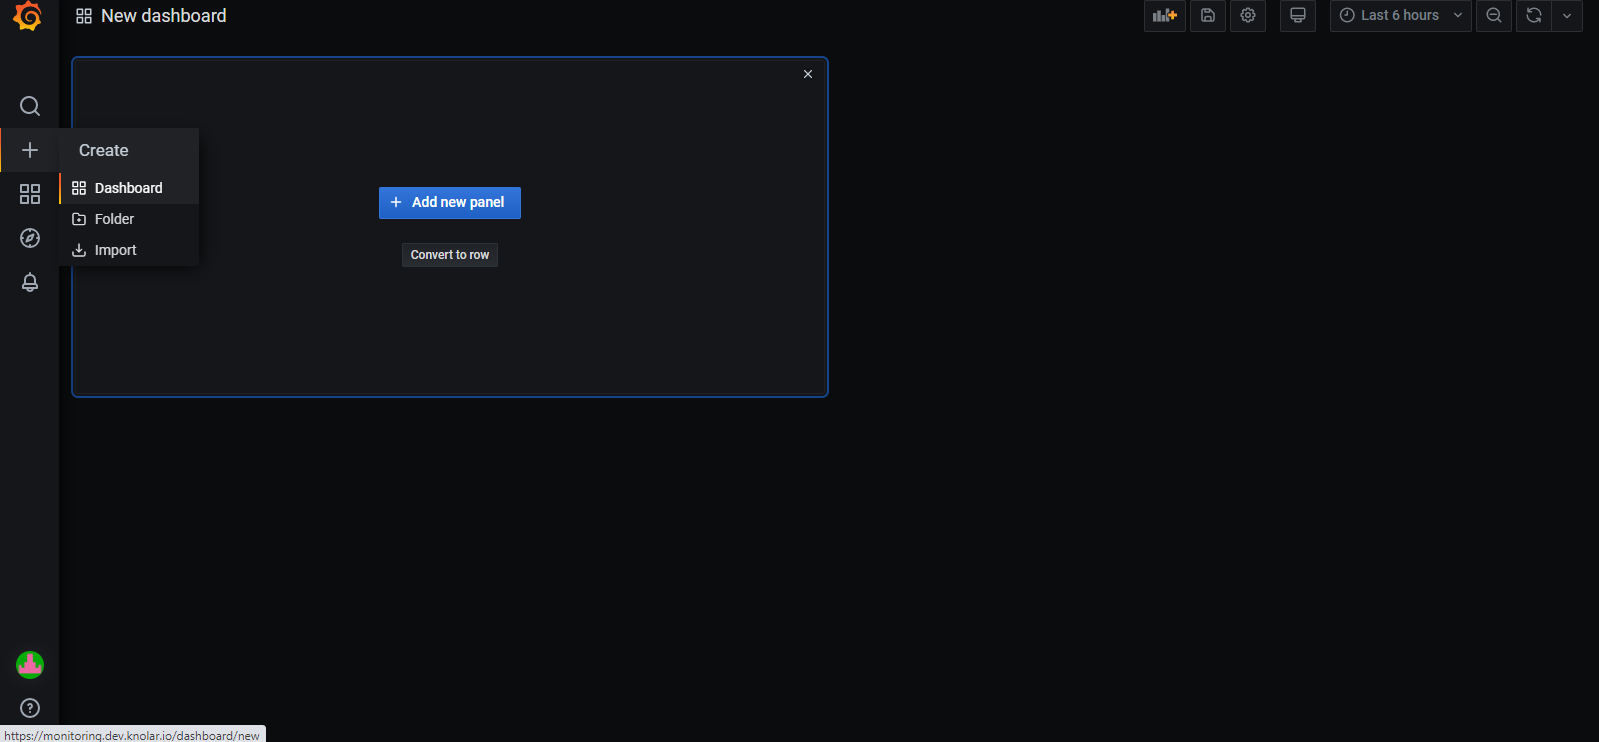
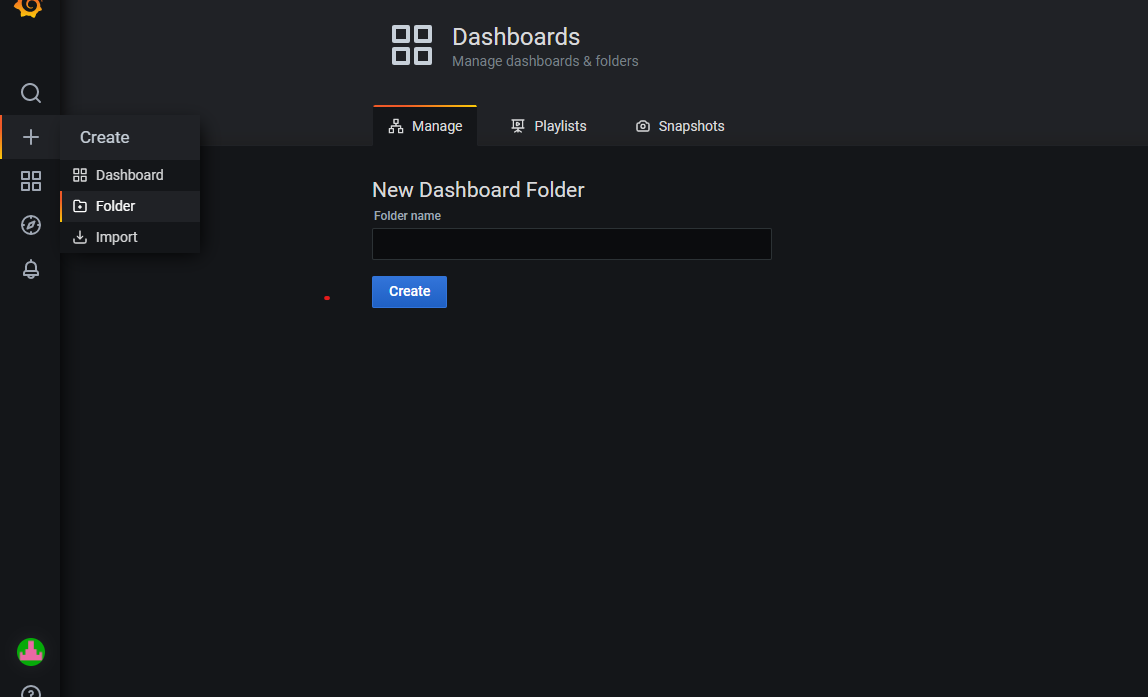
- Folder: It allows you to create a new folder. It also redirects you to a new section called 'manage'.
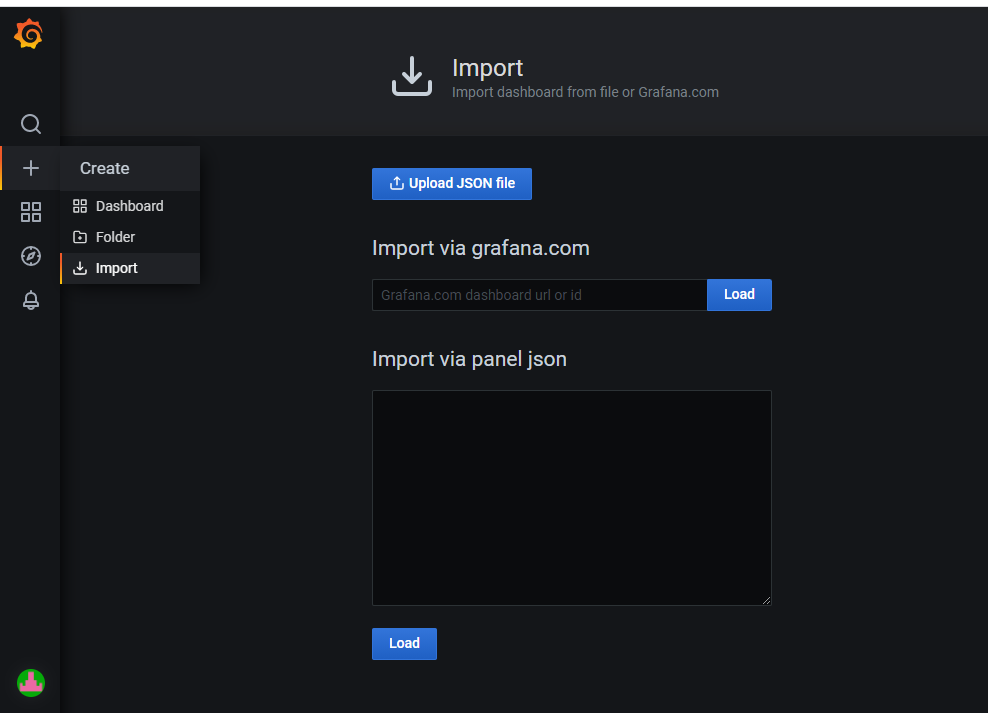
- import: You can import a dashboard using different ways.
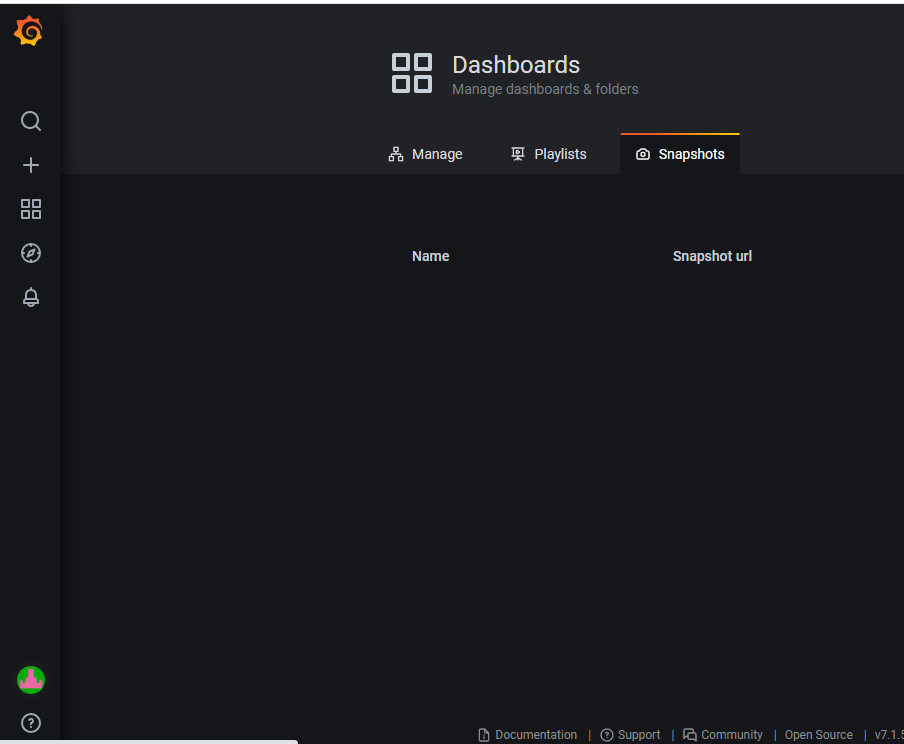
Dashboard: Firstly, you can find 'Home' section that takes you to the main screen, to see all the dashboard already created and secondly, three new sections appear:
- Manage: Focused on an overview of the dashboard. Its organization
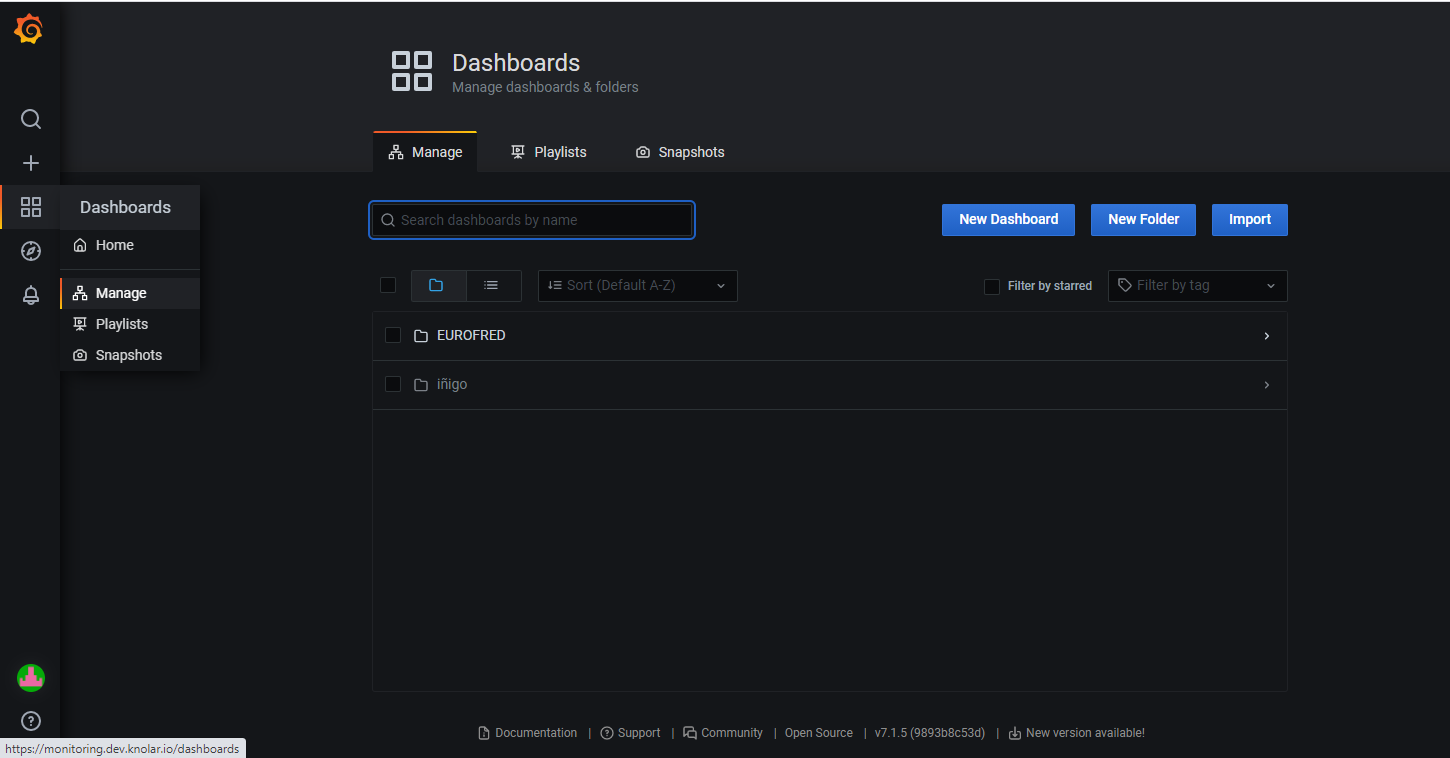
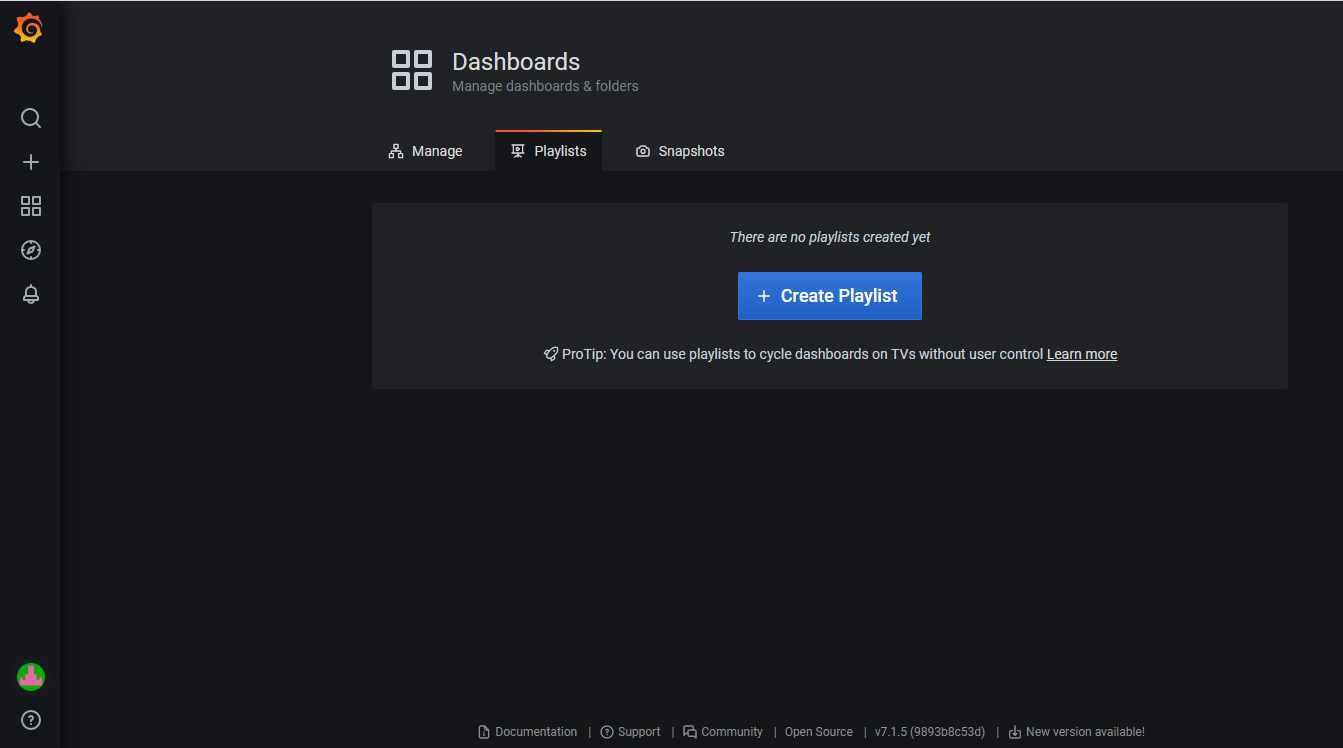
- Playlists: You can use playlists to cycle dashboards on TVs without user control
- Snapshots: Generates an image of a specific section of the dashboard
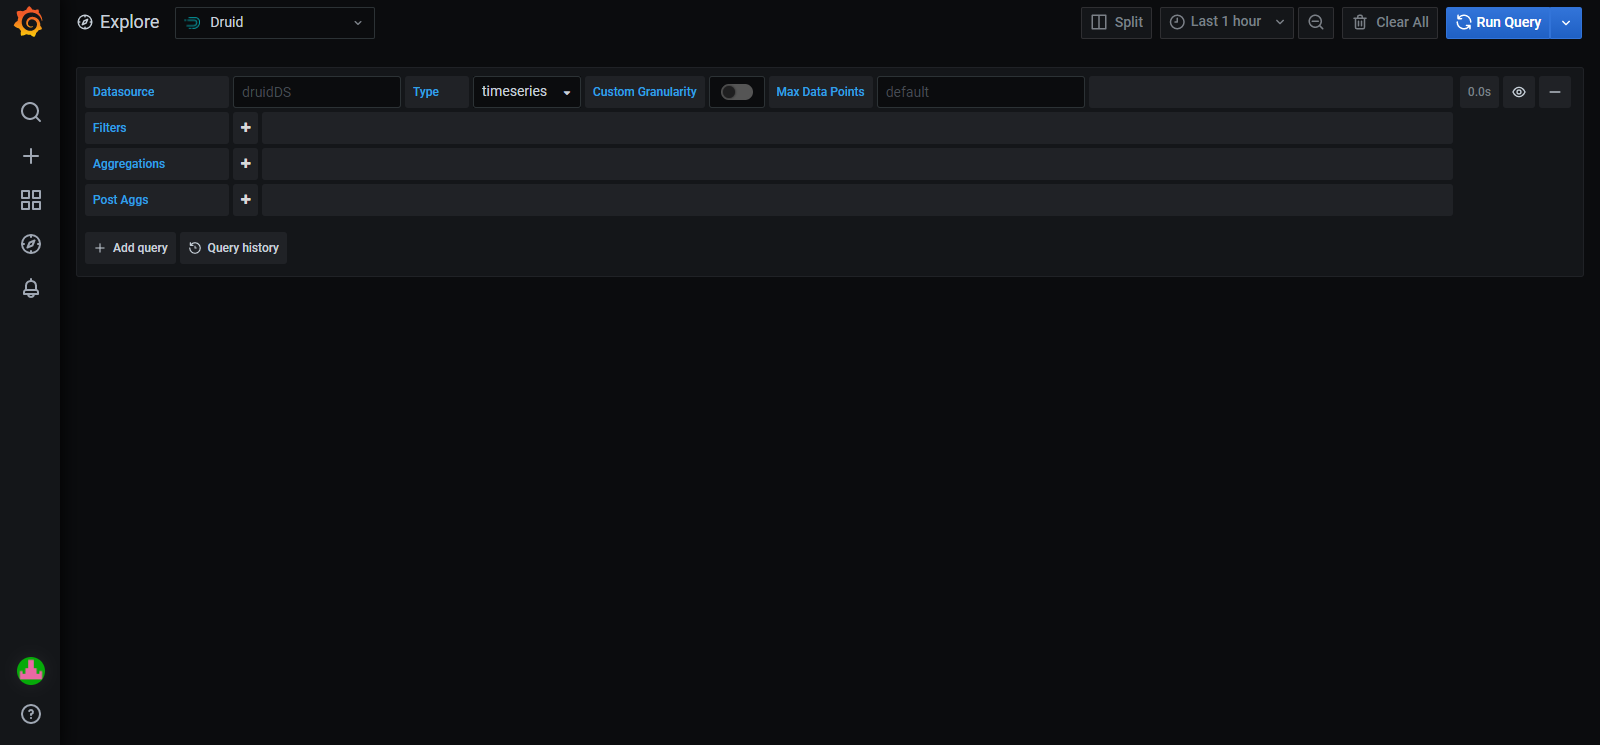
Explore: It helps you iterate until you have a working query and then think about building a dashboard, explore shows the results both as a graph and a table. This allows you to see trends in the data and more details at the same time.
- Alerting: There are two sections (alert rules and notification channels) all of them focused on alerting us of the diffetent steps we are creating in Grafana.
# Superset - Charts & Dashboards
Connecting to a new database we need to add the connection credentials to your database to be able to query and visualize data from it.
Under the Data menu, select the Databases option:
Next, click the + button in the top right corner:
You can configure a lot of thing in this window:
# Registering a new table
you should refer to the SQLAlchemy documentation for your target database. Click the Test Connection button to confirm things work. if the connection is good complete the rest of the field and saved.
Now you need to configure a data source, selecting specific tables you want exposed in superset for querying. Navigate to sources ‣ table and select the + button in the top right corner.
A new window will appear in front of you, select your Database, Schema, and Table. In the following example, we register the table from the examples database.
To finish click the save button. You should now see your dataset in the list of datasets.
# Customizing column properties
Now you’ve registered your dataset, Now that you've registered your dataset, you can configure column properties for how the column should be treated in the Explore workflow: • Is the column temporal? (should it be used for slicing & dicing in time series charts?)
• Should the column be filterable?
• Is the column dimensional?
• If it's a datetime column, how should Superset parse the datetime format? (using the ISO-8601 string pattern)
# Superset semantic layer
Superset has a semantic layer that add a lot of qualities of improvement for analysts. Also can store 2 types of computed data. 1.Virtual metrics: you can write SQL queries that aggregate values from multiple column (e.g. SUM(recovered) / SUM(confirmed)) and make them available as columns for (e.g. recovery_rate) visualization in Explore. Agggregate functions are allowed and encouraged for metrics.
2.Virtual calculated columns: you can write SQL queries that customize the appearance and behavior of a specific column (e.g. CAST(recovery_rate) as float). Aggregate functions aren't allowed in calculated columns.
# Creating chart in explore view
Superset has 2 different interfaces for exploring data Query search : SQL lab: SQL IDE for cleaning, joining, and preparing data for Explore workflow
To start the Explore workflow from the Datasets tab, the name of the dataset that will be powering your chart.
• The Dataset view on the left-hand side has a list of columns and metrics, scoped to the current dataset you selected.
• The Data preview below the chart area also gives you helpful data context.
• Using the Data tab and Customize tabs, you can change the visualization type, select the temporal column, select the metric to group by, and customize the aesthetics of the chart.
As you customize your chart make sure to click the Run button to get visual feedback.
# manage access to dashboards
Access to dashboard is manage via owners (users that have edit permissions to the dashboard). 1.Dataset permissions - if you add to the relevant role permissions to datasets it automatically grants implict access to all dashboards that uses those permitted datasets.
2.Dashboard roles - if you enable DASHBOARD_RBAC feature flag then you be able to manage which roles can access the dashboard.
• Having dashboard access implicitly grants read access to the associated datasets, therefore all charts will load their data even if feature flag is turned on and no roles assigned to roles the access will fallback to Dataset permissions.
Access to dashboard is manage via owners ( users that have edit permissions to the dashboard)
1.dataset permissions if you add to the relevant role permission to dataset it automatically grant implicit access to all dashboards that uses those permitted dataset
3.Dashboard role if you enable dashboard_rbac feature flag then you be able to manage which roles can access the dashboard
4.Having dashboard access implicitly grant reead access to the associated datasets Therefore all charts will load their data even if features flag is turned on and no roles assigned to roles the access will fallback to dataset Permissions
# Data Consumption
# Excel Add-In
CPH provides you a Microsoft Excel add-in with which you can consult your data, in the form of a time series, using Microsoft Excel. Once you have loaded the data, you will be able to operate and visualize it with Microsoft Excel in a simple way.
# Prerequisites
The software requirements for using this add-in are:
- Office 2016 or higher.
- Internet Explorer 11 or higher.
# Installation of the Add-in
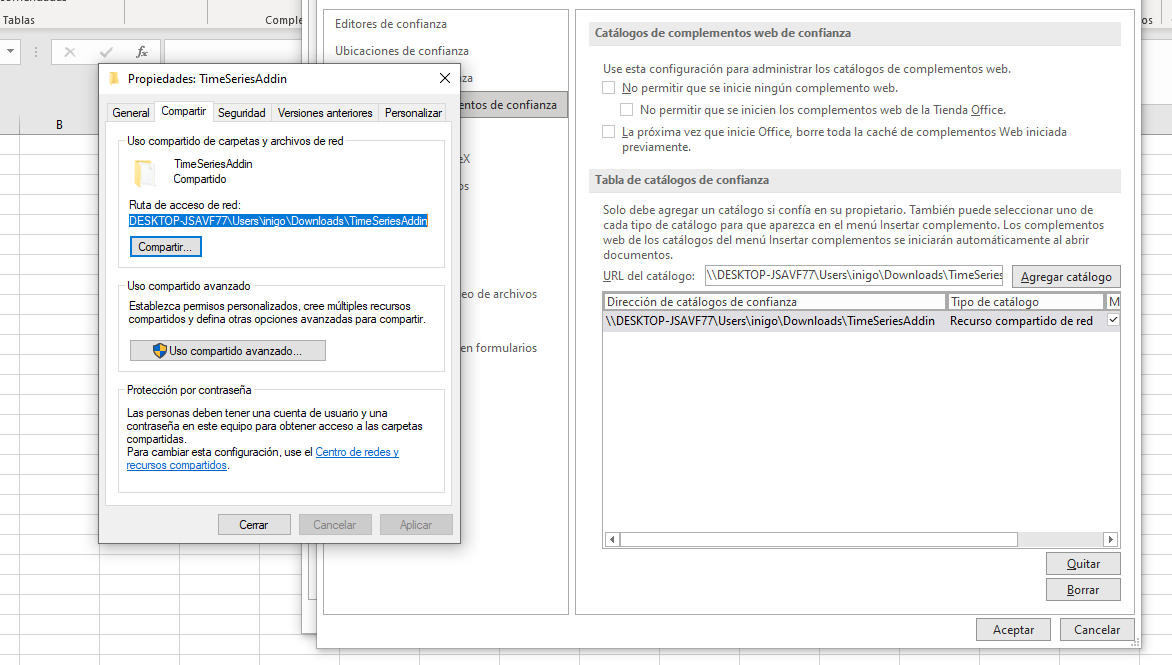
To install an add-in in Microsoft Excel you must download to your computer a manifest file (extension .xml).
Una Once downloaded and configured, it is loaded into Microsoft Excel in order to load and use the add-in.
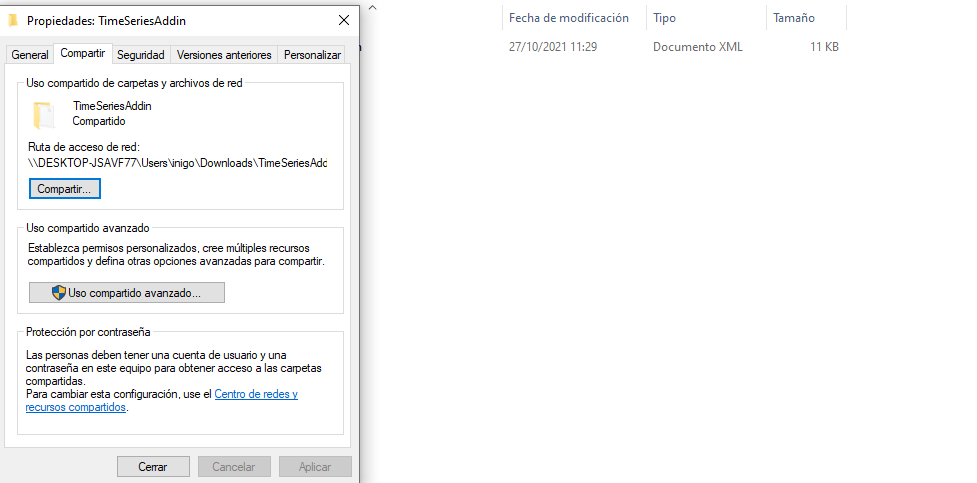
# Manifest File
Download the manifest file by clicking on the link above and go to the folder where you saved it. By right clicking on the mouse and selecting Properties, a context window will open with tabs on it. Choose the tab Share nd share the directory that contains it:
# Microsoft Excel add-in instalation
- Open Microsoft Excel and, in the upper menu, choose File -> Options -> Trust Center.
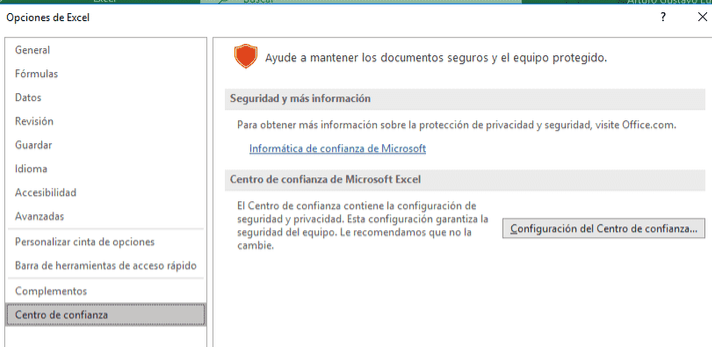
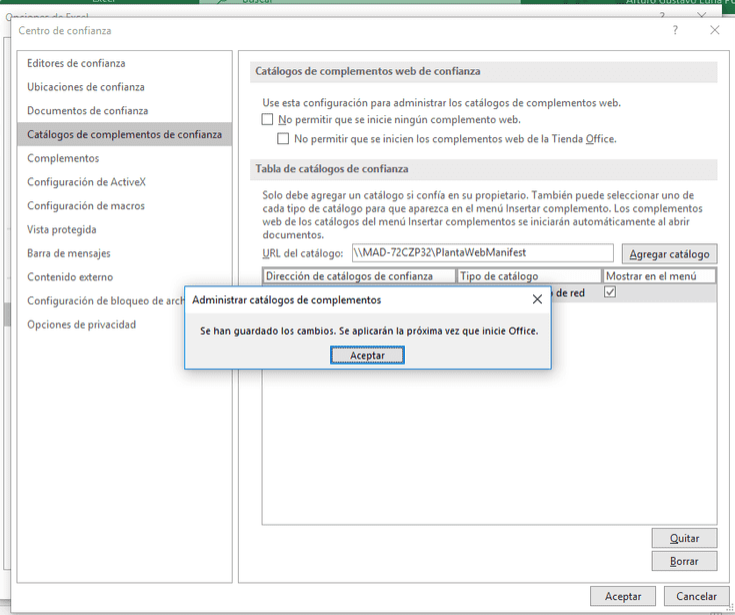
- Once there, click on Trust Center Settings and go to the Trusted Add-in Catalogs menu.
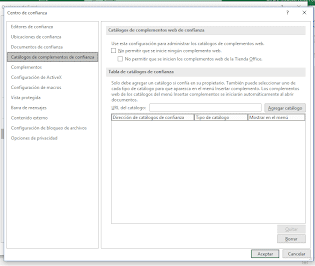
- At this point, you must click on Add catalogue and enter the location to the manifest file that you downloaded earlier. Example: If you have the manifest file in 'C:\Documents\myDocs<manifest_file>' you must enter this path.
- Click on Accept.
- Restart Microsoft Excel to apply these changes and load the add-in.
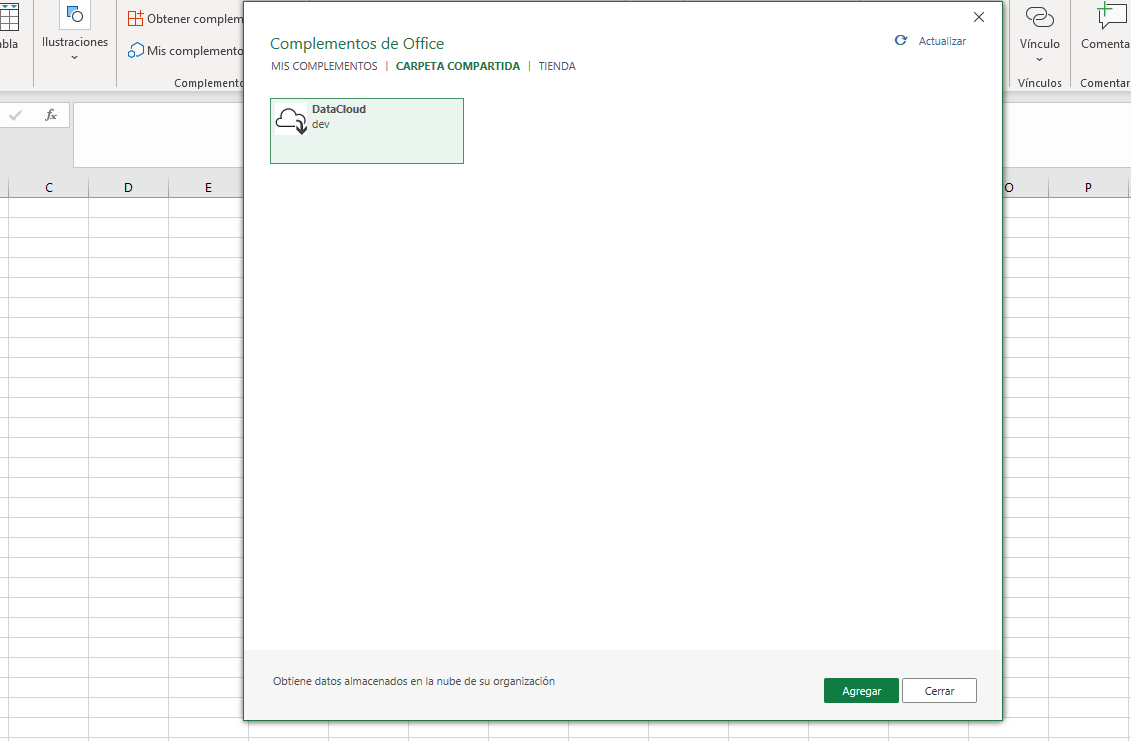
- Re-open Microsoft Excel and from the top menu choose Insert -> Add-Ins -> My Add-Ins. The context window will display a series of tabs.
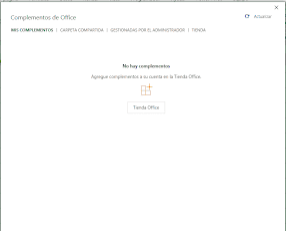
- Click on the tab for Shared Folder.
- You should see the Excel add-in we downloaded and shared earlier. Select the add-in and click the Add button.
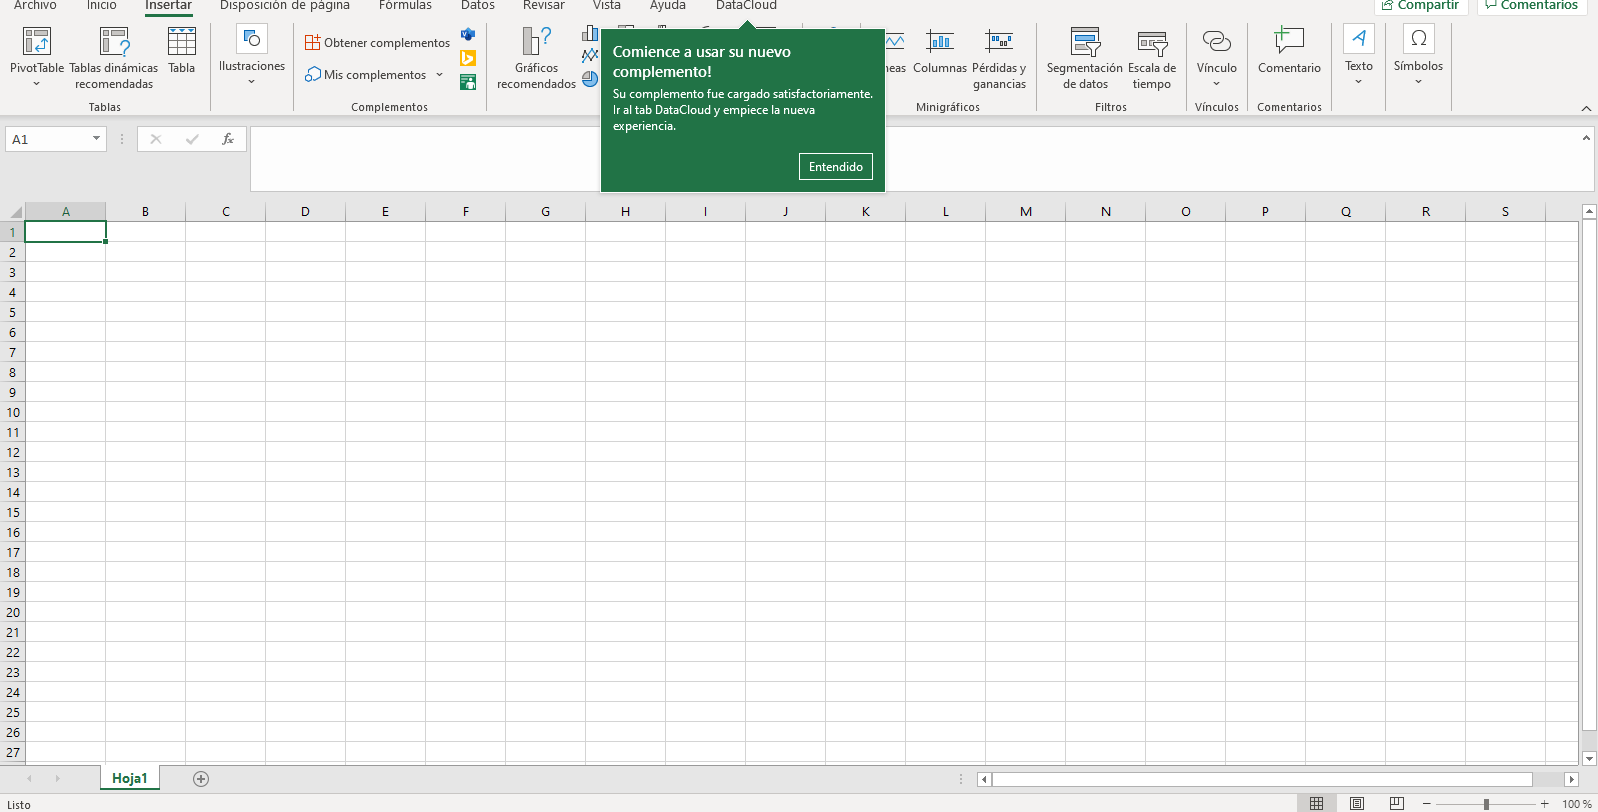
- The modal window will close and you should see that Microsoft Excel informs you that a new add-in has been added and is ready to be used. Once installed, you can activate it in the new menu and interact with it.
# API developers Portal
Knolar has an exclusive section for the use of different APIs. To access the section you must select APIs & Services --> Developers Portal in the menu at the top left.
Once you access it, you must register (you will find the button on the top right). In the APIs section you will find the two different types of APIs that Knolar has implemented (CPH Developers Ingestion API and CPH Developers Consumption API). Within each section you will see the different methods that can be executed along with a brief explanation. To see the use of each of the methods you can access the API Reference section of the documentation (Here (opens new window)). In addition, Here (opens new window) you can find an example of how to ingest data using APIs.